The Trader’s Almanac: Unlocking the Market’s Hidden Rhythm with Seasonality

Have you ever had that feeling that the market just has a certain… mood? Some months feel like a relentless grind, while others seem to offer up opportunities on a silver platter. You’re not imagining it. This is market seasonality at play—a hidden rhythm that, once understood, can provide a powerful tailwind for your trading.

As traders, we build our strategies on structure, trend, and confluence. Seasonality is one of the most overlooked yet potent layers of that confluence. It’s the big-picture context; the prevailing current that can either help push your trades toward their targets or create a frustrating headwind you have to fight against.

Think of it like this: if your trading plan is your vehicle, seasonality is the weather report. You wouldn’t set off on a long road trip without checking the forecast, right? So let’s dive deep into the S&P 500’s historical patterns and learn how to use this “trader’s almanac” to our advantage.

More Than Just an Old Adage: Why This Matters

Before we break down the calendar, let’s be clear: seasonality is not a crystal ball. It’s a study of historical tendencies and probabilities, not a guarantee of future performance. You would never take a trade based only on the fact that it’s October.

However, when you combine these historical patterns with your core trading strategy—your technical analysis, your understanding of market structure, and your risk management rules—it becomes an incredibly valuable tool. It helps answer questions like:

  • Should I be more aggressive with my profit targets this month?

  • Should I consider reducing my trade size during this period?

  • Is the current market weakness typical for this time of year, or is it a sign of something more serious?

Understanding these patterns gives you a strategic edge and helps you stay psychologically prepared for what the market might throw at you.

The Big Picture: A Market of Two Halves

Before we even look at individual months or quarters, the most powerful seasonal trend is the division of the year into two distinct six-month periods.

  1. The “Best Six Months” (November – April): This is historically the most bullish period for the S&P 500. It kicks off with the strong year-end rally and carries that momentum through the first quarter. This is the market’s prime time, fueled by holiday optimism, fresh institutional allocations, and positive sentiment. During this phase, the market has a statistical tailwind.

  2. The “Worst Six Months” (May – October): This period is home to the famous adage, “Sell in May and Go Away.” While the market doesn’t necessarily fall for six straight months, historical returns during this half of the year are significantly weaker than in the first half. It’s a period often defined by summer slowdowns, lower liquidity, and the dreaded September slump. Here, we face a statistical headwind.

Just knowing which half of the year you’re in provides a massive top-down bias for your trading plan.

A Quarter-by-Quarter Deep Dive

Now, let’s zoom in and see how these broader patterns play out on a quarterly basis.

Q1 (January – March): The Optimism Quarter 🚀

The year typically starts strong. Q1 is often driven by a sense of renewal, with institutional investors putting new capital to work.

  • What to Expect: The quarter often starts with the January Effect, where optimism can fuel buying pressure. While February can sometimes be a bit choppy or see a minor pullback, March often finishes the quarter on a high note. Overall, Q1 is a period of net strength.
  • Sectors to Watch: Technology and Financials often perform well as investors place their bets for the year ahead.

Q2 (April – June): The Transition Quarter

Q2 is a tale of two halves. It starts with a bang but often ends with a whimper as the market transitions into its weaker seasonal period.

  • What to Expect: April is historically one of the strongest months of the year, often benefiting from positive sentiment carrying over from Q1. But then comes May, and the “Sell in May and Go Away” phenomenon begins to take hold. Market performance tends to become more subdued or choppy as we head into the summer.
  • Sectors to Watch: As the quarter progresses, you might see a rotation from growth-oriented sectors toward more defensive ones, like Utilities and Consumer Staples.

Q3 (July – September): The Summer Doldrums & September Slump 📉

Welcome to what is historically the weakest and trickiest quarter of the year. If there’s a time to be defensive and patient, this is it.

  • What to Expect: The quarter often begins with the “summer doldrums.” Trading volume thins out from late June through August, leading to choppy, sideways price action that can frustrate trend-followers. Then comes September, which holds the crown as the single worst-performing month for the S&P 500 historically. This is the peak of the statistical headwind.

Q4 (October – December): The Power Quarter 💪

After navigating the treacherous waters of Q3, traders are often rewarded with the strongest quarter of the year.

  • What to Expect: October has a reputation for being volatile and has hosted some infamous crashes, but it’s also known as a “bear killer” month where major bottoms are often formed. This sets the stage for November and December—two of the most consistently bullish months, supercharged by holiday cheer and institutional window dressing.

A Closer Look: The Personality of Each Month

While thinking in quarters is great for a high-level view, zooming in on the individual months reveals even more of the market’s unique character.

  • January: Generally positive, riding the wave of New Year optimism.

  • February: Often a cool-down month, where the market digests earlier gains. Can be choppy.

  • March: Tends to be a solid month, finishing the first quarter with strength.

  • April: A Standout Star ⭐. Historically one of the best months for the market. It’s the heart of the Q2 strength and a time to look for bullish opportunities.

  • May: The “Sell in May” period begins. Returns often become much more muted as the market enters its weaker half.

  • June: A mixed month that can see some chop as the summer doldrums begin to set in.

  • July: Often a bright spot in the summer, sometimes producing a decent rally before the late-summer weakness.

  • August: Performance is often sluggish with low volume as many traders are on vacation.

  • September: The Red Month 🚩. This is the one to circle on your calendar. Historically, September is the single worst-performing month for the S&P 500. It’s a time for maximum caution and defensive posturing.

  • October: The Volatile Turnaround Artist 🎢. Famous for its volatility and historical crashes, October is also known as a “bear killer.” It’s often the month where the market finds its footing after the Q3 weakness and begins its powerful year-end ascent.

  • November & December: The Power Duo 🏆. These two months are the engine of the Q4 rally. November is historically very strong, and December follows it up with the famous “Santa Claus Rally” into the year’s end. This is the market’s prime season for bullish momentum.

Putting It All Together: A Practical Framework

Now that we’ve seen the market’s rhythm from the annual, quarterly, and monthly perspectives, how do we actually use this in our day-to-day trading?

  1. Start with the Top-Down Context: First, identify where you are in the six-month cycle. Are you in the bullish (Nov-Apr) or bearish (May-Oct) half of the year? This sets your primary bias.

  2. Layer on Your Core Strategy: Seasonality is a background element, not the main event. Your primary focus should always be on market structure, trend, and price action on your key timeframes (Weekly, Daily, 4-Hour). A seasonal tailwind is useless if you’re buying directly into major resistance.

  3. Use It as a Confluence Factor: When a high-quality technical setup (like a bounce from a key support zone) aligns with a strong seasonal period (like November), that’s an A+ setup. Conversely, if you see a potential long setup in mid-September, the seasonal headwind should make you demand even more confirmation before taking the trade.

  4. Manage Risk Accordingly: Use seasonality to inform your risk parameters. In a strong seasonal period like Q4, you might feel more comfortable scaling into a winning trade. In a weak period like Q3, you might trade smaller sizes and be quicker to take profits.

By viewing the market through this seasonal lens, you add a layer of depth to your analysis, helping you to stay patient when you need to be and act decisively when the probabilities are stacked in your favor.

Stop Guessing: 4 Numbers That Can Define Your S&P 500 Trading Day

Hey everyone,

Let’s talk about the difference between gambling and trading. A gambler hopes. A trader prepares. A gambler plays on a feeling. A trader executes based on a statistical edge. For years, I’ve told traders in our room that the path to consistency is paved with discipline, a solid plan, and an understanding of what the market is most likely to do on any given day.

While no single day is ever a certainty, we can stack the odds so far in our favor that our decision-making becomes ten times clearer. How? By knowing the market’s habits.

I recently went over a deep-dive statistical report on the E-mini S&P 500 (ES), and a few numbers stood out with such force that they simply cannot be ignored. These aren’t just interesting data points; they are foundational probabilities that can shape your entire approach to the trading day. I’m talking about stats with probabilities over 80%, and today, I’m sharing four of the most powerful ones with you.

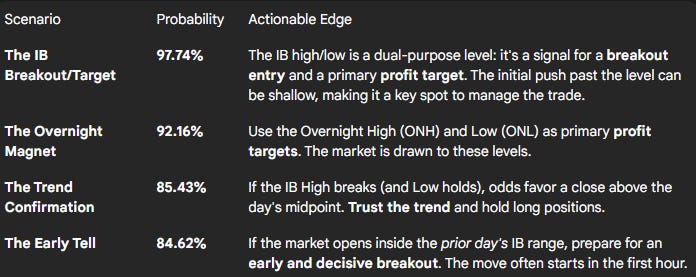
1. The Breakout is Almost a Guarantee (97.74%)

First, let’s talk about the Initial Balance (IB). For those who don’t know, this is the price range established in the first hour of the regular session (8:30-9:30 AM CT). This initial range is a benchmark for the day’s sentiment.

Here’s the killer stat: There is a 97.74% probability that the price will break either the high or the low of that initial one-hour range at some point during the trading day.

Think about that. The market is telling us, with near certainty, that the first hour’s range is not the final word. It’s the opening act.

How to use this: Our entire strategy is about finding our edge at the edges, and the IB high and low are the first critical ones drawn each day. These levels serve a powerful dual role. First, they are high-probability profit targets. If you’re in a move heading toward the IB, this is a prime spot to secure gains. Second, they are the launchpad for the day’s larger move. A sustained break and acceptance beyond the IB is the market signaling that the opening act is over and the real trend is beginning. This is the level to watch for a breakout, not a blind fade.

2. The Overnight Magnet (92.16%)

The overnight session isn’t just random noise. It establishes key levels that act as magnets for price during the regular trading day. The two most important are the Overnight High (ONH) and the Overnight Low (ONL).

The data shows that the market will touch either the ONH or the ONL during the regular session 92.16% of the time.

How to use this: The ONH and ONL are not just reference points; they are high-probability targets. When you’re in a trade, these levels become logical areas to take profits. Price is drawn to them. Whether it rejects hard or blows right through, the probability of at least a test is incredibly high. Mark them on your chart every single morning.

3. The Trend Day Confirmation (85.43%)

Okay, so we’ve had a breakout of the Initial Balance. What next? How do we know if the move has legs? This next statistic gives us a powerful clue.

If the IB High is broken but the IB Low remains intact, there is an 85.43% probability that the session will close above the day’s midpoint.

How to use this: This is your confirmation to trust the trend. If you see a clean, decisive break to the upside from the initial range, the odds are now heavily in your favor that the bullish sentiment will stick for the rest of the day. This should give you the confidence to hold your runners and not exit a winning trade too early, as the data suggests a strong close is likely.

4. The Early Tell (84.62%)

Some days, the market gives you a heads-up that a big move is coming early. This final statistic tells you when to be ready for it.

When the market opens inside the previous day’s Initial Balance range, it has an 84.62% probability of breaking out of that range within the first hour of the current session.

How to use this: If you walk in and see ES opened inside the prior day’s 8:30-9:30 AM range, don’t expect a slow morning. This is a setup for an early, decisive, and often aggressive move. The market is signaling that it’s ready to resolve the indecision from the previous day quickly. Be ready at the bell, because the move is likely coming sooner rather than later.

ES High-Probability Trading Cheat Sheet:

By understanding and applying these four data-backed tendencies, you can move from hoping to preparing. You can build a daily plan around what the market does most of the time, not what you wish it would do.

My Go-To High-Probability Setup: The 80% Rule

Hey everyone,

If there’s one question I get asked more than any other, it’s some version of this: “How do you know where the price is going to go?”

The honest answer? I don’t. And neither does anyone else.

As professional traders, we aren’t in the business of prediction; we’re in the business of probability. Our job is to identify market conditions where the odds are stacked in our favor, understand our risk, and execute with discipline. We are probability managers. When we find a setup with a high statistical likelihood of success, we have an edge.

Today, I want to pull back the curtain on one of the most reliable, high-probability setups I look for on a daily basis: The 80% Value Area Rule.

The Foundation: What is the "Value Area"?

Before we dive into the rule itself, we need to understand its foundation, which comes from a methodology called Market Profile.

At its core, Market Profile helps us understand the market as a two-way auction process. The most important concept it gives us is the Value Area (VA). In simple terms, the Value Area is the price range from the previous day where the majority of business was done—typically around 70% of the total volume.

Think of it as the market’s “comfort zone.” It’s the range of prices that buyers and sellers deemed fair and where they were most willing to transact. Prices outside this area are, by definition, considered less fair or “unfair” by the previous day’s participants. This distinction between “fair” and “unfair” prices is the key to everything.

The Setup: The 80% Rule Explained

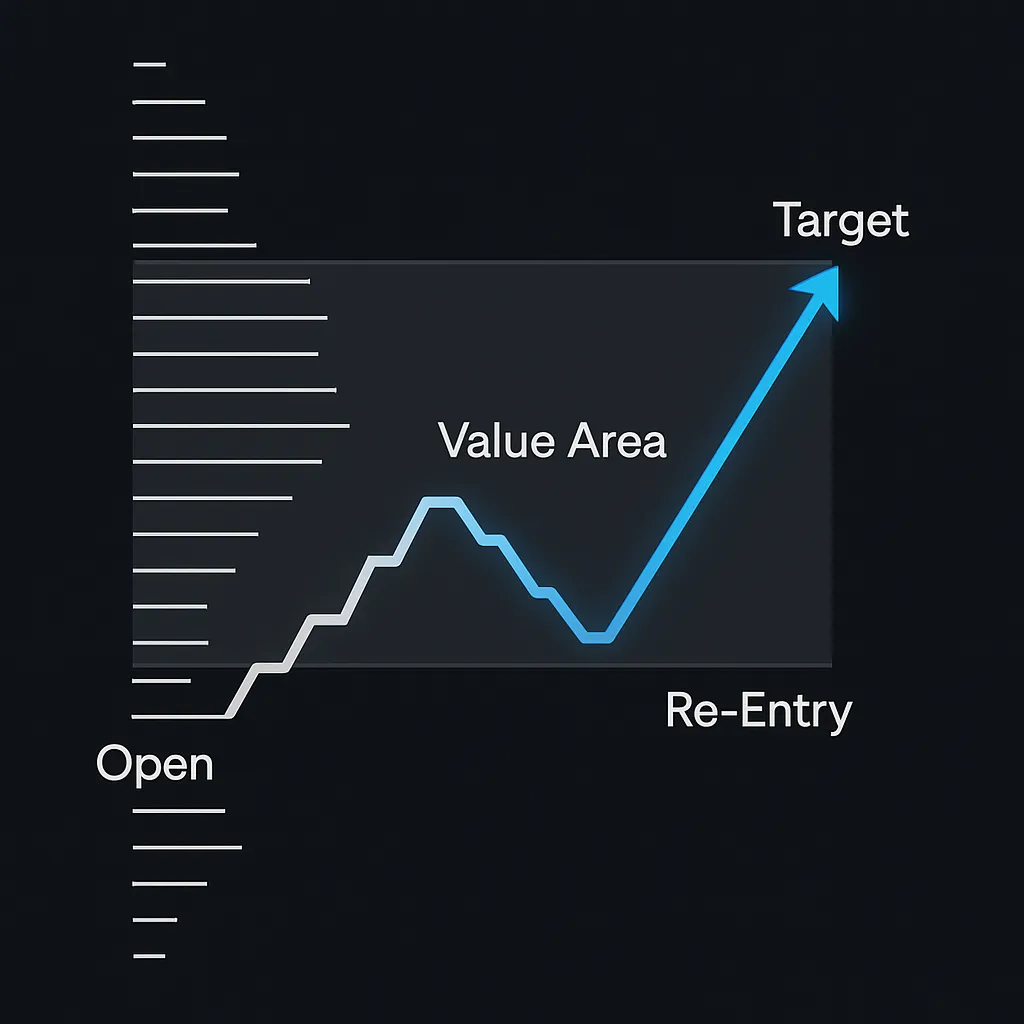
The rule itself, as described in the image you may have seen, is elegant in its simplicity. I have verified this pattern across years of data, and its logic is rooted in sound auction market theory.

Here are the conditions for the setup:

  1. Open Outside of Value: The market must open outside of the previous day’s Value Area. If it opens above the Value Area High (VAH), we watch for a bearish setup. If it opens below the Value Area Low (VAL), we watch for a bullish setup.

  2. Failed Auction & Re-Entry: After opening outside, the market fails to find new business and reverses to re-enter the prior day’s Value Area.

  3. Confirmation of Acceptance: This is the trigger. We need to see price “accepted” back inside the Value Area. The classic confirmation signal for this is seeing at least two consecutive 30-minute periods (or TPO prints) close back inside the VA. This signals that the move outside was rejected and the market now views the prior day’s value as the “fair” place to trade again.

Once these three conditions are met, the 80% Rule is active. It states there is now an ~80% probability that the market will trade all the way across the Value Area to the other side.

  • If the market opened below, re-entered the VA, and was accepted, the target is the Value Area High (VAH).

  • If the market opened above, re-entered the VA, and was accepted, the target is the Value Area Low (VAL).

How I Personally Trade This Setup

This isn’t just a textbook theory for me; it’s an actionable trade I actively hunt. When I see the potential for an 80% Rule trade, it gets my full attention.

My process is proactive, not reactive. I identify the prior day’s VAH and VAL during my pre-market prep.

  1. The Trigger: I am patiently watching for the open outside of value. Once price moves back inside, my alert is on. I use the 15-minute chart to monitor the potential trigger, but my confirmation is based on higher timeframes as per my trading rules—I want to see sustained acceptance back inside the VA, not just a quick pop. The two 30-minute closes is a classic signal, but building a position after the first 30-minute close is also part of my plan.

  2. The Entry: Once I have confirmation, I look to enter the trade. My entry will be a resting order placed just inside the value area (near the VAL for a long, or VAH for a short) at some sort of significant support or resistance. My goal is to get in on a small pullback after the acceptance is clear.

  3. The Stop-Loss: My stop is always placed just outside the Value Area. If the market reverses again and moves back out of the VA, the premise of the trade is invalidated. This gives me a clearly defined and manageable risk.

  4. The Target: My primary target is the other side of the Value Area. With an 80% probability on my side, this is a trade where I have the confidence to let it work, aiming for a large reward relative to my initial risk.

This setup is powerful because it provides everything a professional trader needs: a statistical edge, a clear entry trigger, a defined risk (stop-loss), and a logical target. It’s the definition of a high-probability trade.

Mastering Options Greeks: Your Key to Successful Options Trading Everyday Examples to how Options Greeks Affect YOU!

Mastering Options Greeks

Mastering Options Greeks is a vital component in the pursuit of success within the complex world of options trading. These mathematical measures, which include primary Greeks like Delta, Gamma, Theta, Vega, and Rho, as well as secondary Greeks such as Charm, Vanna, Vomma, and Zomma, enable traders to assess the impact of various factors on option prices. By delving into each Greek and exploring real-life applications, this blog post aims to emphasize their significance in making informed decisions and effectively managing risk. While the primary Greeks are indispensable for options traders, the secondary Greeks, though less critical, offer valuable additional insights to further enhance trading performance. Now let’s take a look at each Greek individually and see how they work during our trading day.

Primary Greeks:

  • Delta (Δ):

Delta measures the sensitivity of an option’s price to a $1 change in the underlying asset’s price. Call options have positive Delta (0 to 1), meaning their price increases as the underlying asset’s price increases, while put options have negative Delta (-1 to 0), meaning their price increases as the underlying asset’s price decreases.

Example: Suppose a trader owns a call option with a Delta of 0.6. If the underlying asset’s price increases by $1, the option’s price would increase by $0.60. Traders can use Delta to hedge their positions by creating Delta-neutral portfolios, which help minimize directional risk. For instance, a trader with a long call option position could sell shares of the underlying asset in a ratio that corresponds to the option’s Delta to offset any potential losses.


  • Gamma (Γ):

Gamma measures the rate of change in an option’s Delta for a $1 change in the underlying asset’s price. Gamma is highest for at-the-money options and decreases for both in-the-money and out-of-the-money options.

Example: If an at-the-money call option has a Gamma of 0.1 and the underlying asset’s price increases by $1, the option’s Delta would increase from 0.5 to 0.6. Traders can use Gamma to anticipate how their positions’ directional exposure will change as the market moves. Monitoring Gamma is essential for managing risk, especially for traders engaged in strategies like gamma scalping, where they aim to profit from the change in an option’s Delta as the underlying asset’s price fluctuates.


  • Theta (Θ):

Theta measures the sensitivity of an option’s price to the passage of time, also known as time decay. Theta is generally negative for both call and put options, meaning that the option’s value decreases as time passes, all else being equal.

Example: Suppose a trader owns a call option with a Theta of -0.05. If one day passes and all other factors remain constant, the option’s value would decrease by $0.05. Traders can use Theta to assess the impact of time decay on their positions and choose options with different expiration dates to balance the effects of time decay.


  • Vega (ν):

Vega measures the sensitivity of an option’s price to changes in the underlying asset’s implied volatility. Vega is positive for both call and put options, meaning that the option’s value increases as implied volatility increases.

Example: If a trader owns a call option with a Vega of 0.15 and the implied volatility of the underlying asset increases by 1%, the option’s value would increase by $0.15. Traders can use Vega to manage their positions’ exposure to changes in implied volatility, adjusting their option strategies to account for anticipated changes in market volatility.


  • Rho (ρ):

Rho measures the sensitivity of an option’s price to changes in the risk-free interest rate. Call options have positive Rho, meaning their value increases as interest rates

increase, while put options have negative Rho, meaning their value decreases as interest rates increase.

Example: If a trader owns a call option with a Rho of 0.03 and the risk-free interest rate increases by 1%, the option’s value would increase by $0.03. Traders can use Rho to manage their positions’ exposure to changes in interest rates, adjusting their strategies to account for anticipated shifts in monetary policy or economic conditions.

Secondary Greeks:

  • Charm (or Delta Bleed):

Charm measures the rate of change in an option’s Delta with respect to the passage of time, essentially capturing how Delta evolves as time passes. Charm is typically negative for call options and positive for put options.

Example: Suppose a trader owns a call option with a Charm of -0.02. If one day passes, the option’s Delta would decrease by 0.02, all else being equal. Traders can use Charm to anticipate and manage the impact of time decay on their positions’ directional risk.


  • Vanna:

Vanna measures the sensitivity of an option’s Delta to changes in the underlying asset’s implied volatility. Vanna can help traders understand how changes in implied volatility may impact their positions’ directional risk.

Example: If a trader owns a call option with a Vanna of 0.04 and the implied volatility of the underlying asset increases by 1%, the option’s Delta would increase by 0.04. Traders can use Vanna to adjust their positions to account for anticipated changes in implied volatility, helping them manage directional risk more effectively.


  • Vomma (or Volga):

Vomma measures the sensitivity of an option’s Vega to changes in the underlying asset’s implied volatility. Vomma is typically positive for both call and put options.

Example: Suppose a trader owns a call option with a Vomma of 0.05. If the implied volatility of the underlying asset increases by 1%, the option’s Vega would increase by 0.05. Traders can use Vomma to anticipate and manage the impact of changes in implied volatility on their Vega exposure, allowing them to better navigate volatile markets.


  • Zomma (or DvegaDspot):

Zomma measures the sensitivity of an option’s Gamma to changes in the underlying asset’s implied volatility. A positive Zomma value indicates that Gamma increases as implied volatility increases, while a negative Zomma value indicates that Gamma decreases as implied volatility increases.

Example: If a trader owns a call option with a Zomma of 0.01 and the implied volatility of the underlying asset increases by 1%, the option’s Gamma would increase by 0.01. Traders can use Zomma to understand how changes in implied volatility may affect the convexity of their options positions, which in turn can influence the effectiveness of their hedging strategies.


Mastering the primary Greeks is crucial for successful options trading, as they help traders manage risk and make informed decisions. The secondary Greeks, while not as critical, provide additional insights that can enhance traders’ understanding of their positions. By incorporating these mathematical measures into their strategies, options traders can better navigate the complex world of options trading and improve their overall performance. Possessing a thorough understanding of how the Greeks impact your options trading strategies can provide you with a competitive advantage, enabling you to enhance your profit potential.


Intro to Options Trading: A Comprehensive Guide

Options,Trading,Man,Hand,On,Table,Business,,Coffee,,Split,Tone

Options trading can be an exciting and lucrative way to participate in the financial markets. This powerful trading instrument provides traders with unique opportunities to profit from various market scenarios, manage risk, and diversify their portfolios. In this comprehensive guide, we will explore the world of options trading, covering essential concepts, strategies, and risk management techniques to help you become a successful options trader. Learn More

Understanding Calls and Puts

Before diving into advanced strategies and risk management, it is crucial to understand the basic concepts of options trading. An option is a financial contract that gives the buyer the right, but not the obligation, to buy (call option) or sell (put option) an underlying asset at a specific price (strike price) before or on a predetermined date (expiration date). Call options are typically used for long positions, where traders expect the price of the underlying asset to rise. Conversely, put options are used for short positions, where traders anticipate a decline in the asset’s price.

Buying vs. Selling Options

In options trading, you can choose to buy or sell options contracts. Buying options (also known as “going long”) gives you the right to exercise the option, while selling options (also known as “going short” or “writing” options) obligates you to fulfill the terms of the contract if the buyer decides to exercise.

Advantages of Buying Options:

  1. Limited risk: When you buy options, your maximum loss is limited to the premium paid for the contract.
  2. Leverage: Options allow you to control a large position in the underlying asset with a relatively small investment.
  3. Flexibility: You can profit from various market scenarios using different options strategies.

Disadvantages of Buying Options:

  1. Time decay: The value of options contracts decreases over time, especially as they approach expiration.
  2. Low probability of profit: Many options contracts expire worthless, which means the buyer loses the premium paid.

Advantages of Selling Options:

  1. Time decay: Option sellers benefit from time decay, as the value of the option they sold decreases over time.
  2. Higher probability of profit: Since many options contracts expire worthless, sellers often have a higher probability of profit.
  3. Passive income: Selling options can generate additional income through the collection of premiums.

Disadvantages of Selling Options:

  1. Unlimited risk: When selling naked options, your potential losses can be unlimited, exposing you to significant risk.
  2. Margin requirements: Selling options typically requires a margin account, which involves borrowing funds from your broker and can increase your risk exposure.

The Basics of Options Trading

There are two main types of options: American and European. American options can be exercised at any time before the expiration date, while European options can only be exercised on the expiration date. Options can be traded on various underlying assets, including stocks, indices, commodities, currencies, and more.

Options Trading Strategies

Options trading offers a myriad of strategies that cater to different market outlooks, risk tolerance levels, and objectives. Some popular options trading strategies include:

  1. Covered Call: This conservative strategy involves holding a long position in an underlying asset while simultaneously selling a call option on the same asset. The goal is to generate additional income from the option premium while providing some downside protection.
  2. Protective Put: This strategy involves owning an underlying asset and purchasing a put option to protect against potential declines in the asset’s value. It acts as an insurance policy, limiting the potential losses in case the asset’s price drops.
  3. Vertical Spread: Vertical spreads involve buying and selling options of the same type (calls or puts) with the same expiration date but different strike prices. These strategies can be used to profit from directional movements in the underlying asset while limiting risk.
  4. Iron Condor: This advanced strategy involves selling an out-of-the-money call and put while simultaneously buying a further out-of-the-money call and put on the same underlying asset. The goal is to profit from the underlying asset’s price remaining within a specific range until the options expire.

Risk Management in Options Trading

Proper risk management is crucial to achieving long-term success in options trading. Here are some essential risk management techniques to consider:

  1. Position sizing: Determine the appropriate size of each trade based on your account size, risk tolerance, and the specific strategy being employed. Avoid allocating a large portion of your capital to a single trade.
  2. Stop-loss orders: Utilize stop-loss orders to limit potential losses on a trade. This can be achieved by closing an options position when the underlying asset’s price reaches a predetermined level or by using stop-loss orders on the underlying asset itself.
  3. Diversification: Diversify your options trading strategies and underlying assets to spread risk across various market sectors and instruments.
  4. Continuous education: Stay informed about market developments, new strategies, and risk management techniques to adapt to changing market conditions and improve your trading skills.

Options trading offers unique opportunities for traders to profit from various market scenarios and manage risk effectively. By mastering the essential concepts, strategies, and risk management techniques, you can enhance your trading skills and achieve long-term success in the world of options trading. Remember to keep learning, stay disciplined, and maintain a focus on risk management to maximize your potential in this exciting and rewarding endeavor.

Mastering Emotional Management in Trading: A Comprehensive Guide Introduction

Stock,Trader,Tearing,Out,His,Hair,From,Despair,,Rear,View

In the world of trading, emotional management is a critical skill to develop for long-term success. Emotions such as fear, greed, hope, and regret can lead traders to make irrational decisions and impulsive actions that negatively affect their performance. This comprehensive guide covers ten essential strategies for managing emotions in trading, helping you achieve better decision-making and enhance your overall trading performance.

1)Develop a Trading Plan

A well-defined trading plan establishes clear guidelines for entering and exiting trades, position sizing, and risk management. Creating and consistently following a trading plan reduces the influence of emotions on your decision-making process.

  • Outline your trading goals and objectives
  • Define your preferred trading style and timeframe
  • Identify your preferred trading instruments and markets
  • Develop specific entry and exit rules based on technical or fundamental analysis
  • Determine risk management strategies, including stop-loss and take-profit orders


2)Set Realistic Expectations

Understanding that losses are an inevitable part of trading helps you manage emotions like disappointment, frustration, and fear. Cultivate a growth mindset by setting realistic expectations for yourself and focusing on continuous improvement.

  • Accept that not every trade will be successful
  • View losses as learning opportunities rather than failures
  • Maintain a long-term perspective and avoid short-term emotional reactions


3)Practice Mindfulness and Meditation

Mindfulness and meditation techniques enable you to stay focused, reduce stress, and maintain emotional balance during trading.

  • Regularly practice mindfulness meditation to increase self-awareness and emotional control
  • Use deep breathing exercises to calm your mind and reduce stress during trading sessions
  • Develop a pre-trade routine to mentally prepare yourself for the trading day


4)Take Breaks and Manage Stress

Regular breaks from trading help prevent emotional exhaustion and burnout. Engage in activities that help you relax and recharge.

  • Establish a daily trading schedule with designated breaks
  • Pursue hobbies and interests outside of trading
  • Spend time with friends and family to maintain a healthy work-life balance


5)Limit Exposure to News and Social Media

Constant exposure to market news and social media can amplify emotions and lead to impulsive decisions. Set specific times for checking news and social media, and avoid making trades based on sensational headlines or the opinions of others.

  • Create a daily routine for consuming market news and updates
  • Utilize reputable sources for news and analysis
  • Develop a healthy skepticism towards sensational headlines and social media hype


6)Maintain a Healthy Lifestyle

Good physical health contributes to better emotional management. Prioritize sleep, exercise, and proper nutrition to keep your body and mind functioning optimally.

  • Establish a regular sleep schedule and ensure adequate rest
  • Engage in regular physical activity to reduce stress and improve overall health
  • Maintain a balanced diet, staying mindful of caffeine and sugar intake


7)Use Stop-Loss Orders

Stop-loss orders automatically close a trade when the price reaches a predetermined level, limiting potential losses. This reduces emotional stress and the temptation to hold onto losing positions in hopes of a recovery.

  • Determine appropriate stop-loss levels based on your risk tolerance and trading strategy
  • Regularly review and adjust stop-loss orders as market conditions change
  • Avoid adjusting stop-loss orders out of fear or greed during a trade


8)Focus on the Process, Not Just the Outcome

Concentrate on executing your trading plan and refining your strategies rather than obsessing over individual trade outcomes.

  • Develop a process-oriented mindset focused on consistency and continuous improvement
  • Regularly review and analyze your trading performance, identifying areas for improvement
  • Celebrate small victories and recognize progress in your trading journey


9)Keep a Trading Journal

Documenting your trades, emotions, and thought processes can help you identify patterns and emotional triggers.

  • Record details of each trade, including entry and exit points, position size, and trade outcome
  • Note any emotions or thoughts experienced before, during, and after each trade
  • Regularly review your trading journal to identify patterns, emotional triggers, and areas for improvement
  • Use your journal insights to develop strategies for better emotional management and decision-making in future trades


10)Seek Support and Education

Engaging with a trading community, seeking the advice of a mentor, or enrolling in trading courses can provide valuable guidance, support, and perspective.

  • Join trading forums or social media groups to share experiences and learn from others
  • Find a mentor or experienced trader who can offer guidance and advice
  • Invest in your education by attending webinars, workshops, or enrolling in trading courses
  • Stay up-to-date with market developments and industry news to continuously improve your trading knowledge

Mastering emotional management in trading is a key component of long-term success in the markets. By implementing these ten strategies, you can develop the skills and mindset needed to make more objective decisions, maintain discipline, and enhance your overall trading performance. Remember, trading is a journey that requires continuous learning and self-improvement, and emotional management is an essential skill to develop along the way.


Overcoming Trading Fatigue: Tips for Maintaining Mental Resilience and Performance Introduction

Fatigue,Man,Sleeps,On,His,Home,Office,Desk,While,Trading,

Trading can be an exciting and rewarding endeavor, but it also comes with its fair share of challenges. One such challenge is trading fatigue, which refers to the mental exhaustion and emotional burnout that traders can experience after spending excessive time monitoring and engaging in the markets without taking sufficient breaks or maintaining a healthy work-life balance. In this article, we’ll explore the signs of trading fatigue, its impact on performance, and effective strategies for overcoming it to stay sharp, focused, and successful in your trading journey.

 Recognizing the Signs of Trading Fatigue

Trading fatigue can manifest in various ways, and being aware of these symptoms can help you identify and address the issue early on. Common signs of trading fatigue include:

 Difficulty concentrating

Traders experiencing fatigue may find it challenging to maintain focus on market analysis and trading activities, leading to suboptimal decisions and missed opportunities.

 Emotional decision-making

Fatigued traders often allow emotions like fear, greed, or frustration to influence their decisions, leading to impulsive trades that deviate from their well-defined strategy.

Overtrading

Exhaustion can drive traders to take excessive trades or constantly adjust positions, often due to a fear of missing out or an urge to recoup losses.

Reduced discipline

Trading fatigue can result in neglecting risk management rules or straying from the trading plan, leading to increased exposure and potential losses.

Lowered motivation

Fatigued traders may experience a lack of enthusiasm or interest in trading activities, which can hinder their performance and progress.

The Impact of Trading Fatigue on Performance

Trading fatigue can have significant negative consequences on a trader’s decision-making abilities and overall performance. Some of these consequences include:

Suboptimal trade executions

When traders are fatigued, they may not be able to execute trades as efficiently or accurately as they would when they are well-rested and focused.

Increased risk-taking

Fatigue can impair a trader’s judgment, leading to increased risk-taking and the potential for more significant losses 

Reduced overall performance

Trading fatigue can hinder a trader’s ability to perform at their best, leading to a decline in overall trading performance and profitability. 

Strategies for Overcoming Trading Fatigue

To combat trading fatigue and maintain mental resilience, consider implementing the following strategies: 

Maintain a healthy work-life balance

Set boundaries for your trading activities and allocate time for hobbies, socializing, exercise, and relaxation to prevent burnout.

Take regular breaks

Stepping away from the screens for short breaks throughout the day can help prevent mental exhaustion and improve focus.

Establish a trading routine

A structured daily routine can help manage your time effectively and ensure you’re not overextending yourself. 

Prioritize self-care

Focus on maintaining a healthy lifestyle, including proper nutrition, exercise, and sleep, to support optimal cognitive function and emotional well-being.

Manage stress

Utilize stress-reduction techniques such as meditation, deep breathing exercises, or yoga to help manage the inherent stress that accompanies trading. 

Set realistic expectations

Understand that losses are an inevitable part of trading, and focus on the long-term process rather than short-term outcomes. 


Building Mental Resilience for Long-term Success

Overcoming trading fatigue is essential for maintaining mental resilience and achieving long-term success in the markets. By addressing trading fatigue and prioritizing self-care, traders can improve their mental and emotional resilience, leading to better decision-making and overall trading performance. 

Develop a growth mindset

Embrace challenges and view setbacks as opportunities for growth and learning. Cultivate a mindset that focuses on continuous improvement, and be open to feedback and new ideas.

Foster emotional intelligence

Develop self-awareness and the ability to regulate your emotions during the trading process. This will help you maintain a calm and composed demeanor, even in the face of market volatility and uncertainty.

Practice mindfulness

Incorporate mindfulness practices such as meditation or deep breathing exercises into your daily routine. Mindfulness can enhance focus, reduce stress, and promote overall mental well-being. 

Build a support network

Connect with fellow traders, friends, or family members who can provide encouragement and support during challenging times. Sharing experiences and discussing challenges can help you gain valuable insights and maintain a positive outlook.

Trading fatigue is a common challenge that traders face, and it can significantly impact their decision-making abilities and overall performance. Recognizing the signs of trading fatigue and implementing effective strategies to overcome it are crucial for maintaining mental resilience and achieving long-term success in the markets. By prioritizing self-care, developing a healthy work-life balance, and continuously refining your mental and emotional resilience, you can optimize your trading performance and enjoy a fulfilling and successful trading journey.

epts to learn, it can be hard to know where to begin. That’s why we’ve put together this guide to help you get started on your trading journey.

First things first: what is online trading? Online trading refers to the buying and selling of financial instruments such as stocks, bonds, currencies, and commodities using an online platform. This means that you can trade from anywhere, at any time, as long as you have an internet connection.

Before you start trading, it’s important to have a solid understanding of some key concepts. Let’s take a look at a few of them:

Market: A market is a place where buyers and sellers come together to trade financial instruments. There are many different markets, such as the stock market, the forex market, and the commodities market.

Broker: A broker is a person or company that facilitates trades between buyers and sellers. Brokers can provide you with access to different markets and trading platforms.

Buy/Sell: When you buy an asset, you are purchasing it with the expectation that its price will rise in the future. When you sell an asset, you are selling it with the expectation that its price will fall in the future.

Order: An order is an instruction to buy or sell an asset at a certain price. There are different types of orders, such as market orders, limit orders, and stop-loss orders.

Risk: Trading involves risk, which means that you may lose money. It’s important to understand the risks involved and to have a solid risk management plan in place.

Now that you have a basic understanding of some key concepts, it’s time to choose a trading platform and start trading. When choosing a platform, consider factors such as the fees, the range of assets available, and the ease of use. Once you’ve chosen a platform, it’s important to start small and gradually build up your experience and knowledge. Don’t risk more than you can afford to lose, and always keep learning and adapting your strategies.

To help you learn more about trading terminology, we’ve compiled an extensive list of trading terms that you can reference as you continue your trading journey. Remember to stay informed, stay disciplined, and always be willing to learn. Happy trading!

Mastering the Language of Trading: A Beginner’s Guide to Understanding Trading Terms

Fake,Dictionary,,Dictionary,Definition,Of,The,Word,Terms.,Including,Key

Getting started with online trading can be both exciting and daunting. With so many terms and concepts to learn, it can be hard to know where to begin. That’s why we’ve put together this guide to help you get started on your trading journey.

First things first: what is online trading? Online trading refers to the buying and selling of financial instruments such as stocks, bonds, currencies, and commodities using an online platform. This means that you can trade from anywhere, at any time, as long as you have an internet connection.

Before you start trading, it’s important to have a solid understanding of some key concepts. Let’s take a look at a few of them:

Market: A market is a place where buyers and sellers come together to trade financial instruments. There are many different markets, such as the stock market, the forex market, and the commodities market.

Broker: A broker is a person or company that facilitates trades between buyers and sellers. Brokers can provide you with access to different markets and trading platforms.

Buy/Sell: When you buy an asset, you are purchasing it with the expectation that its price will rise in the future. When you sell an asset, you are selling it with the expectation that its price will fall in the future.

Order: An order is an instruction to buy or sell an asset at a certain price. There are different types of orders, such as market orders, limit orders, and stop-loss orders.

Risk: Trading involves risk, which means that you may lose money. It’s important to understand the risks involved and to have a solid risk management plan in place.

Now that you have a basic understanding of some key concepts, it’s time to choose a trading platform and start trading. When choosing a platform, consider factors such as the fees, the range of assets available, and the ease of use. Once you’ve chosen a platform, it’s important to start small and gradually build up your experience and knowledge. Don’t risk more than you can afford to lose, and always keep learning and adapting your strategies.

To help you learn more about trading terminology, we’ve compiled an extensive list of trading terms that you can reference as you continue your trading journey. Remember to stay informed, stay disciplined, and always be willing to learn. Happy trading!

Trading Terms:

Alpha: A measure of an investment’s performance relative to a benchmark. Alpha represents the difference between an investment’s actual returns and its expected returns, given its level of risk.

Arbitrage: The practice of buying and selling the same asset in different markets to take advantage of price discrepancies. Traders use arbitrage to profit from price inefficiencies and ensure that markets remain efficient.

Ask Price: The price at which a seller is willing to sell an asset. The ask price is the opposite of the bid price, which is the price at which a buyer is willing to buy an asset.

Asset: Any financial instrument that can be traded, such as a stock, bond, currency, or commodity. Assets can be bought and sold in various financial markets, including the stock market, forex market, and commodity market.

Base Currency: The first currency in a currency pair that is being traded, typically the domestic currency of the country in which the trader is located. The base currency is used to determine the exchange rate of the currency pair.

Bear Market: A market in which asset prices are falling. A bear market is typically characterized by declining investor confidence and negative economic sentiment.

Beta: A measure of an asset’s volatility relative to the market. Beta is used to assess the riskiness of an asset and is calculated by comparing its returns to the returns of a benchmark, such as the S&P 500.

Blue Chip: A company that is considered to be financially stable and has a long history of consistent growth and dividend payments. Blue chip companies are typically large, well-established companies that are leaders in their respective industries.

Bollinger Bands: A technical indicator that measures the volatility of an asset and helps traders identify potential breakouts or reversals. Bollinger Bands are typically drawn on a price chart and consist of three lines: a simple moving average, an upper band, and a lower band.

Broker: An individual or firm that executes trades on behalf of clients. Brokers can provide traders with access to various financial markets and offer a range of services, including research and analysis, trading platforms, and customer support.

Bull Market: A market in which asset prices are rising. A bull market is typically characterized by increasing investor confidence and positive economic sentiment.

Buy and Hold: A long-term investment strategy in which an investor buys an asset and holds onto it for an extended period of time. Buy and hold investors aim to profit from the long-term growth of their investments and typically do not engage in frequent trading.

Call Option: A financial contract that gives the holder the right, but not the obligation, to buy an underlying asset at a specified price and time. Call options are typically used by traders who believe that an asset’s price will rise in the future.

Candlestick Chart: A type of chart used to represent the price movement of an asset over time. Each candlestick represents a specific time period and includes information on the asset’s open, close, high, and low prices. Candlestick charts are commonly used in technical analysis to identify trends and patterns in asset prices.

Capital Gains: The profit made from the sale of an asset that has appreciated in value. Capital gains are taxed at a lower rate than ordinary income in many jurisdictions.

Carry Trade: A trading strategy that involves borrowing in a low-yielding currency and investing in a high-yielding currency. Carry trades are typically used to profit from the difference in interest rates between two currencies.

Cash Flow: The amount of cash that flows in and out of a business or investment. Cash flow is an important metric used to evaluate the financial health of a business or investment.

Central Bank: The institution responsible for overseeing a country’s monetary policy and controlling the money supply. Central banks are typically independent entities that are responsible for maintaining price stability and promoting economic growth.

Closing Price: The last price at which an asset traded during a trading session. The closing price is used to calculate daily price movements and is often used as a reference point for technical analysis.

Commodity: A raw material or primary agricultural product that can be bought and sold, such as oil, gold, or wheat. Commodities are traded on various exchanges and are typically priced based on supply and demand dynamics.

Contract for Difference (CFD): A financial contract that allows traders to speculate on the price movements of an underlying asset without owning the asset itself. CFDs are often used to trade stocks, commodities, and forex pairs.

Day Trading: A trading strategy in which a trader buys and sells assets within the same day, with the goal of profiting from small price movements. Day traders typically use leverage to amplify their returns and must be disciplined and patient to succeed.

Deflation: A decrease in the general price level of goods and services in an economy. Deflation is often caused by a decrease in consumer demand and can lead to economic downturns and recessions.

Derivative: A financial instrument that derives its value from an underlying asset, such as an option or futures contract. Derivatives are often used to hedge risk or speculate on the future price movements of an asset.

Diversification: A risk management strategy that involves spreading investments across multiple assets or asset classes to reduce overall risk. Diversification can help investors minimize the impact of any single asset’s poor performance on their overall portfolio.

Dividend: A payment made by a company to its shareholders, typically as a share of the company’s profits. Dividends are often paid out quarterly or annually and are a key source of income for many investors.

Exchange-Traded Fund (ETF): An investment fund that holds a basket of assets and trades on an exchange like a stock. ETFs are often used by investors to gain exposure to a particular market or sector.

Ex-Dividend Date: The date on which a stock begins trading without the right to the upcoming dividend payment. Investors who purchase a stock after the ex-dividend date are not entitled to receive the dividend payment.

Fibonacci Retracement: A technical analysis tool that uses horizontal lines to indicate areas of support or resistance at key Fibonacci levels before the price continues in the original direction. Fibonacci retracements are often used to identify potential price reversal points in asset prices.

Fiscal Policy: Government policy regarding taxation and spending. Fiscal policy is often used to stabilize the economy and promote economic growth.

Fixed Income: An investment that pays a fixed rate of return, such as a bond. Fixed income investments are often used to generate regular income for investors.

Forex (FX): The market in which currencies are traded. Forex is the largest financial market in the world and involves buying and selling currencies in pairs.

Futures Contract: A financial contract that obligates the buyer to purchase an asset and the seller to sell an asset at a predetermined price and time in the future. Futures contracts are often used by traders to hedge risk or speculate on future price movements of an asset.

Hedge Fund: An investment fund that uses a range of sophisticated strategies to generate returns for its investors. Hedge funds often have high minimum investment requirements and are typically only available to accredited investors.

Inflation: An increase in the general price level of goods and services in an economy. Inflation is often caused by an increase in the money supply and can lead to a decrease in the purchasing power of money.

Initial Public Offering (IPO): The first time a company’s stock is offered for sale to the public. IPOs are often used by companies to raise capital and allow investors to buy shares in the company.

Leverage: The use of borrowed funds to increase the potential return on an investment. Leverage can magnify gains, but it can also magnify losses and increase overall risk.

Limit Order: An order to buy or sell an asset at a specific price or better. Limit orders are often used by traders to control the price at which they buy or sell an asset.

Liquidation: The process of selling all of the assets held by an individual or company to pay off debts or obligations. Liquidation can occur voluntarily or involuntarily and can be initiated by the individual or company or by a court order.

Liquidity: The degree to which an asset can be bought or sold quickly and easily without affecting its price. Highly liquid assets can be bought or sold quickly and without much impact on their price, while less liquid assets may take longer to buy or sell and can have a larger impact on their price.

Long Position: A position in which an investor owns an asset with the expectation that its price will rise in the future. Long positions are typically held for an extended period of time and are often used as a part of a buy and hold investment strategy.

Margin: The amount of money that an investor must put up to enter into a leveraged trade. Margin is typically expressed as a percentage of the total value of the trade and is used to cover potential losses.

Market Order: An order to buy or sell an asset at the current market price. Market orders are often used by traders who want to enter or exit a trade quickly and do not want to wait for a specific price.

Moving Average: A technical analysis tool that calculates the average price of an asset over a specific period of time. Moving averages are often used to identify trends in asset prices and can be used to generate buy and sell signals.

Option: A financial contract that gives the holder the right, but not the obligation, to buy or sell an underlying asset at a specified price and time. Options are often used by traders to hedge risk or speculate on the future price movements of an asset.

Pip: The smallest unit of measurement in the forex market. Pips are used to measure the change in the exchange rate of a currency pair and are typically expressed to four decimal places.

Portfolio: A collection of investments held by an individual or institution. Portfolios are often diversified across multiple asset classes to minimize risk and maximize return.

Price to Earnings (P/E) Ratio: A valuation ratio used to measure a company’s current share price relative to its earnings per share. The P/E ratio is often used to assess whether a stock is undervalued or overvalued.

Put Option: A financial contract that gives the holder the right, but not the obligation, to sell an underlying asset at a given price.

Price to Earnings (P/E) Ratio: A valuation ratio used to measure a company’s current share price relative to its earnings per share. The P/E ratio is often used to assess whether a stock is undervalued or overvalued.

Put Option: A financial contract that gives the holder the right, but not the obligation, to sell an underlying asset at a specified price and time. Put options are typically used by traders who believe that an asset’s price will fall in the future.

Quantitative Easing: A monetary policy tool used by central banks to stimulate the economy by increasing the money supply. Quantitative easing involves the purchase of government bonds or other assets to inject liquidity into the financial system.

Resistance Level: A price level at which an asset has historically had difficulty rising above. Resistance levels are often used by technical analysts to identify potential areas of price resistance.

Return on Investment (ROI): A measure of the profitability of an investment relative to its cost. ROI is calculated by dividing the investment’s gains by its cost.

Risk Management: The process of identifying, assessing, and prioritizing risks and developing strategies to mitigate or avoid those risks. Risk management is a critical component of successful trading and investing.

Securities: Financial instruments that represent ownership in a company or organization, such as stocks and bonds. Securities can be bought and sold on various financial markets.

Short Position: A position in which an investor sells an asset with the expectation that its price will fall in the future. Short positions are typically held for a short period of time and are often used to profit from declining asset prices.

Spread: The difference between the bid price and the ask price of an asset. Spreads are typically expressed in pips in the forex market and are an important factor to consider when trading.

Stop Loss: An order placed by a trader to sell an asset at a specific price in order to limit potential losses. Stop losses are often used by traders to manage risk and limit potential losses.

Support Level: A price level at which an asset has historically had difficulty falling below. Support levels are often used by technical analysts to identify potential areas of price support.

Technical Analysis: A method of analyzing asset prices by studying historical price and volume data. Technical analysts use charts and other tools to identify trends and patterns in asset prices and to generate buy and sell signals.

Ticker Symbol: A unique symbol used to identify a publicly traded company or asset. Ticker symbols are often used to look up information on a particular asset or to track its price movements.

Trend: The general direction in which an asset’s price is moving over a period of time. Trends can be up, down, or sideways and are an important factor to consider when trading.

Volatility: The degree to which an asset’s price fluctuates over time. Highly volatile assets can experience large price swings in a short period of time, while less volatile assets tend to have more stable prices.

Yield: The amount of income generated by an investment, typically expressed as a percentage of the investment’s cost. Yield is an important factor to consider when investing in fixed-income securities such as bonds.

Volume: The total number of shares or contracts traded during a given time period. Volume is an important factor to consider when trading and can indicate the level of interest or activity in a particular asset.

Whipsaw: A market condition in which an asset’s price rapidly moves up and down, causing traders to be stopped out of positions. Whipsaws are often caused by market volatility and can be difficult to predict or avoid.

Xetra: A trading system used by the Frankfurt Stock Exchange to facilitate electronic trading of stocks, bonds, and other securities. Xetra is one of the largest and most advanced electronic trading systems in the world.

Year to Date (YTD): The period beginning at the start of the calendar year and ending on the current date. YTD returns are often used to assess the performance of an investment over a given period of time.

Zero-Coupon Bond: A bond that pays no interest and is sold at a discount to its face value. Zero-coupon bonds are typically purchased by investors who are looking for long-term growth and do not need regular income from their investments.

These are just a few of the many trading terms and concepts that are commonly used in the world of finance. As with any field, the language of trading and investing is constantly evolving, so it’s important to stay up-to-date on new terms and developments in the industry.

By expanding your knowledge of trading terminology and concepts, you’ll be better equipped to navigate the complex world of finance and make informed investment decisions.

A Comprehensive Guide to Crafting Your First Trading Plan

Trading,Plan.,Magnifier,And,Yellow,Sticker.,Text,On,White,Paper
Welcome to our trading community! If you’re new to trading and looking to make your mark in the financial markets, you’ve come to the right place. In this article, we’ll walk you through ten essential steps to create a solid trading plan, which serves as the cornerstone of successful trading. We’ll cover everything from defining your goals to refining your strategy, so you can embark on your trading journey with confidence.

Step 1 - Define Your Trading Goals:

The first step in creating a trading plan is to set clear and realistic objectives. Ask yourself what you want to achieve through trading. Are you looking to generate supplemental income, build long-term wealth, or sharpen your trading skills? Defining your goals helps you stay focused and motivated as you navigate the often-turbulent world of trading.

Step 2 - Choose Your Trading Style:

Next, determine which trading style best aligns with your goals, personality, and availability. Common trading styles include: Day trading: Holding positions for a few minutes to a day Swing trading: Holding positions for several days to weeks Position trading: Holding positions for weeks to months Scalping: Holding positions for seconds to minutes Each style has its own time horizon and risk profile, so choose one that resonates with you and fits your lifestyle.

Step 3 - Select Your Trading Instruments:

Now it’s time to decide on the financial instruments you’ll focus on, such as stocks, forex, options, or futures. Factors like market liquidity, volatility, and your level of expertise play a role in determining which instruments are most suitable for your trading plan.

Step 4 - Develop a Trading Strategy:

Research and choose a trading strategy that aligns with your chosen style and instruments. Trading strategies can be based on technical analysis, fundamental analysis, or a combination of both. Popular strategies include trend following, mean reversion, and breakout trading.

Step 5 - Risk Management:

Establish clear risk management rules to protect your capital. Define your risk tolerance and set stop-loss and take-profit levels to limit potential losses. Allocate a specific percentage of your total trading capital to each trade (e.g., 1-2%) to avoid overexposure.

Step 6 - Establish Entry and Exit Criteria:

Outline specific conditions for entering and exiting trades to maintain discipline and reduce emotional decision-making. These criteria should be based on your chosen trading strategy and may include indicators, chart patterns, or news events.

Step 7 - Create a Trade Journal:

Document every trade in a journal, noting the rationale behind your decisions, entry and exit points, and the resulting profit or loss. Regularly reviewing your journal helps you analyze your performance, identify areas for improvement, and refine your trading strategy.

Step 8 - Backtest and Refine Your Strategy:

Before committing real capital, backtest your strategy using historical data to assess its effectiveness. Make necessary adjustments based on the results and continue to fine-tune your strategy as you gain experience.

Step 9 - Develop a Trading Routine:

Establish a daily routine for preparing, executing, and reviewing your trades. This may involve scanning the markets for opportunities, setting up your trading environment, and reflecting on your trade journal.

Step 10 - Continuous Learning and Improvement:

Stay updated on market news and developments, and commit to ongoing education. Regularly evaluate your trading performance and strategy, and adapt as needed to maintain consistent progress towards your goals.

Creating a comprehensive trading plan is crucial for new traders looking to succeed in the financial markets. By following the steps outlined in this guide, you’ll be well on your way to building a strong foundation for your trading journey. Remember, patience, discipline, and dedication are key to achieving your trading goals. Good luck, and happy trading!